1. Introduction to Statistics
Intro to Stats
Struggling with Statistics for Business?
Join thousands of students who trust us to help them ace their exams!Watch the first videoMultiple Choice
You collect the test scores of every other student in a class. Is this data set a population or sample?
A
Population
B
Sample
 Verified step by step guidance
1
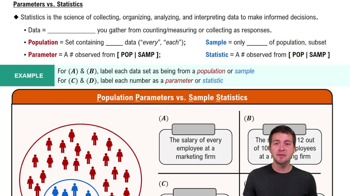
Understand the definitions: A 'population' refers to the entire group that you are interested in studying, while a 'sample' is a subset of the population that you actually collect data from.
Identify the group of interest: In this scenario, the group of interest is all the students in the class.
Determine the data collection method: You collected the test scores of every other student, which means you did not collect data from every student in the class.
Compare the data set to the group of interest: Since you collected data from only a subset of the class (every other student), this data set represents a sample, not the entire population.
Conclude based on definitions: Since the data set is a subset of the class, it is a sample. A population would require data from every student in the class.

 5:53m
5:53mWatch next
Master Parameters vs. Statistics with a bite sized video explanation from Patrick
Start learningRelated Videos
Related Practice