4. Probability
Basic Concepts of Probability
Struggling with Statistics for Business?
Join thousands of students who trust us to help them ace their exams!Watch the first videoMultiple Choice
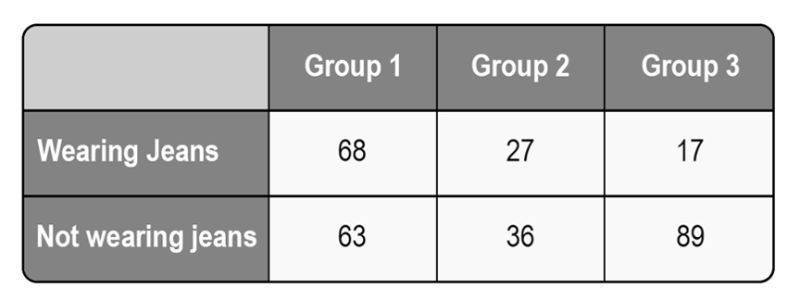
Given the data below, determine the probability that a person randomly selected from Group 1 will be wearing jeans.
A
B
C
D
 Verified step by step guidance
1
Identify the total number of people in Group 1. This is the sum of people wearing jeans and not wearing jeans in Group 1.
Calculate the total number of people in Group 1 by adding the number of people wearing jeans (68) and the number of people not wearing jeans (63).
Determine the probability that a person randomly selected from Group 1 is wearing jeans by dividing the number of people wearing jeans by the total number of people in Group 1.
Use the formula for probability: P(Wearing Jeans) = (Number of people wearing jeans in Group 1) / (Total number of people in Group 1).
Substitute the values into the formula: P(Wearing Jeans) = 68 / (68 + 63).

 5:37m
5:37mWatch next
Master Introduction to Probability with a bite sized video explanation from Patrick
Start learningRelated Videos
Related Practice
